


Our crops are beautiful
- Adriaan van Niekerk

- Nov 10, 2018
- 1 min read
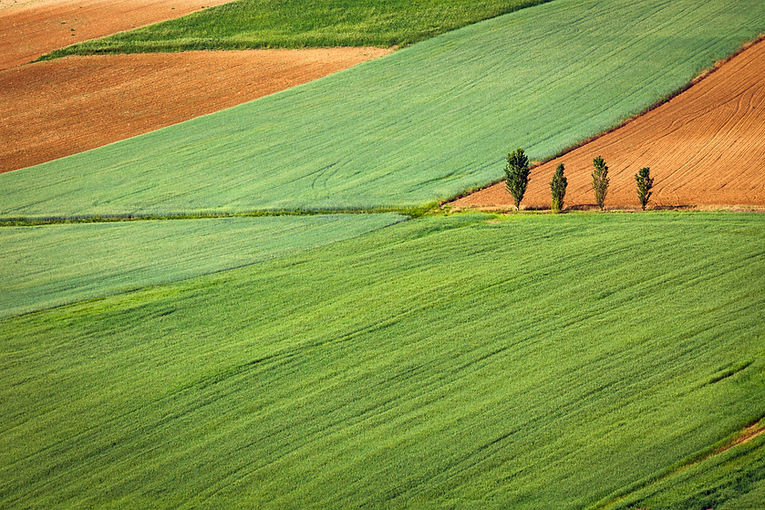
I was playing around with some Sentinel-2 images and accidentally created this image (if you are interested in the technical stuff, see "Technical Stuff" below). Essentially, the colors in the image depict temporal variations (phenology) in crop growth throughout the recent winter season (June to November). Isn't it beautiful? This one is definitely going onto my wall...

Technical Stuff
The image was generated by performing a principle component analysis (PCA) on a series of soil adjusted vegetation index (SAVI) images of Douglas, South Africa. The resulting image represents the first three components, with Red = PC1, Green = PC2, Blue = PC3. The main crops grown in the area (during winter) are wheat, barley and alfalfa (lucerne). As one would expect, there is a strong relationship between the principle components and the different crop types, which was the main goal of performing PCA in the first place. Resent research has shown that PCA is very effective for crop type differentiation, especially when combined with machine learning.
This article was originally published on www.remotesensing.blog, which is devoted to articles about the use of remote sensing and other geospatial technologies for agricultural and related applications.
See related posts:


Comments